Node Quick Start [Impact Analysis]
This guide is meant to get you started using Impact Analysis with Codecov as quickly as possible on node projects. Note that there are some caveats due to how coverage collection is implemented in Node and v8. You can read more about those here.
Prerequisites
In order to get started, you will need a repository that is
- using Node 15.1 or higher
- already integrated with Codecov
- running in a production-like environment
Getting Started
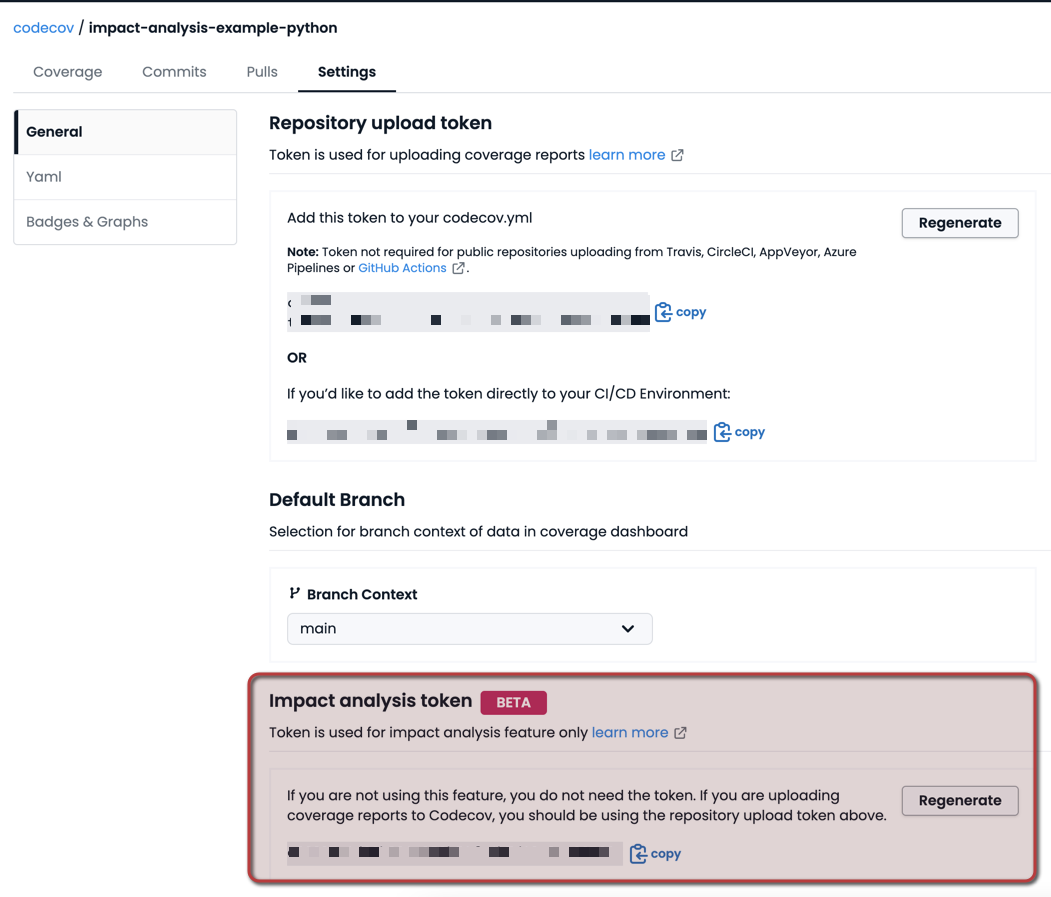
Step 1: Get your Impact analysis token
In your repository settings page on Codecov, copy the Impact analysis token to be used when uploading telemetry reports

Step 2: Update your dependencies
Add the following dependency by running:
npm install @codecov/node-codecov-opentelemetrybe sure to save the dependency to your package.json file.\
Step 3: Add the following environment variable
Set environment variable for coverage export. You will not need to access this directory yourself, but the application will read coverage reports from this directory:
export NODE_V8_COVERAGE=codecov_reports
Step 3: Add in the Codecov OpenTelemetry package
The following code should be used in the startup of your application, typically this is app.js. For a basic express app, it would look as follows:
// Include Dependencies
const { CodeCovOpenTelemetry }  = require('@codecov/node-codecov-opentelemetry');
const { NodeTracerProvider } = require('@opentelemetry/sdk-trace-node');
const { BatchSpanProcessor } = require("@opentelemetry/sdk-trace-base");
const { SpanKind } = require("@opentelemetry/api");

// Setup OpenTelemetry
const sampleRate = 1;
const untrackedExportRate = 1;
const code = 'production::v0.0.1' //<environment>::<versionIdentifier>
const provider = new NodeTracerProvider();
provider.register();

// Setup Codecov OTEL
const codecov = new CodeCovOpenTelemetry(
  {
    repositoryToken: "your-impact-analysis-token", //from repository settings page on Codecov.
    environment: "production", //or others as appropriate
    versionIdentifier: "v0.0.1", //semver, commit SHA, etc
    filters: {
      allowedSpanKinds: [SpanKind.SERVER],
    },
    codecovEndpoint: "api.codecov.io",
    sampleRate,
    untrackedExportRate,
    code
  }
)

provider.addSpanProcessor(codecov.processor);
provider.addSpanProcessor(new BatchSpanProcessor(codecov.exporter))
Once initialized, your application can continue as expected. For example when using express:
// Code snippet from above goes here.

//...example express setup app.js file
const express = require('express');
const port = 3000;
const app = express();

app.get('/', (req, res) => {
  res.send('Hello World!');
})
Configuration Details
The following table describes the variables used in the configuration snippets lines 17 through 26 above:
variable | description |
|---|---|
versionIdentifier |
|
environment |
|
code | A unique identifier for the current deployment across all environments where it may be deployed. Conventionally, this is a combination of version number and environment name, but can be anything as long as it is unique in each environment for the version being deployed. |
sampleRate |
|
repositoryToken |
|
untrackedExportRate | Currently unused, should remain at 0. |
If desired, the filters parameter can also be changed to provide different filtering on any valid OpenTelemetry SpanKind as defined by the specification.
Step 4: Update the codecov.yaml configuration
In order to get Impact Analysis data in your pull requests, add the following lines of code to your codecov.yaml file
comment:
  layout: "diff,flags,tree,betaprofiling"
  show_critical_paths: true
Commit the above code and run your code in production as usual. Note that it may take 30 minutes for the changes to propagate.
Seeing Impact Analysis in your pull requests
After you have followed the steps above, you will need to run the code in a production-like environment. To see changes in your pull requests, make a code change on
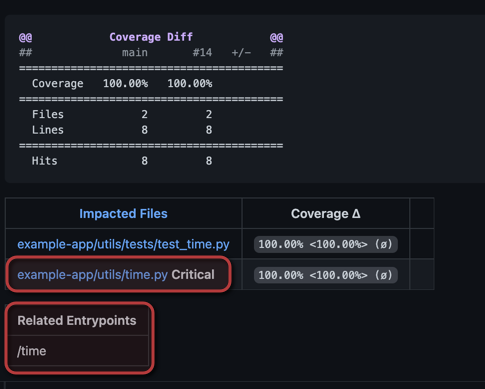
You should be able to see two differences. The first notates Critical on files that have code run frequently in production that are also being changed. The second shows API endpoints that are affected by the pull request.

If you are making changes to code that is not deemed critical, you should still see the following in your pull request comment from Codecov.

Integration Examples
The specifics of how this library is integrated into your project depend on the project itself. This section contains a few common, framework-specific, integration approaches along with the general integration approach at the end.
Note that these examples demonstrate possible ways to incorporate this package into your project. As always, your specific needs may vary.
Express
The full example can be seen here, the below code snippet just shows the most relevant aspects of an express app using Impact Analysis:
const { CodeCovOpenTelemetry }  = require('../lib/runtime-insights.js');
const { NodeTracerProvider } = require('@opentelemetry/sdk-trace-node');
const { BatchSpanProcessor } = require("@opentelemetry/sdk-trace-base");
const { SpanKind } = require("@opentelemetry/api");

// OTEL setup logic
const sampleRate = 1;
const untrackedExportRate = 1;
const code = 'production::v0.0.1' //<environment>::<versionIdentifier>

const provider = new NodeTracerProvider();
provider.register();

// Codecov setup Logic
const codecov = new CodeCovOpenTelemetry(
  {
    repositoryToken: "your-impact-analysis-token", //from repository settings page on Codecov.
    environment: "production", //or others as appropriate
    versionIdentifier: "v0.0.1", //semver
    filters: {
      allowedSpanKinds: [SpanKind.SERVER],
    },
    codecovEndpoint: "https://api.codecov.io",
    sampleRate,
    untrackedExportRate,
    code
  }
)

provider.addSpanProcessor(codecov.processor);
provider.addSpanProcessor(new BatchSpanProcessor(codecov.exporter))

const express = require('express');
const port = 3000;
const app = express();

app.get('/', (req, res) => {
  res.send('Hello World!');
})

// other routes here...

app.listen(port, () => {
  console.log(`Example app listening at http://localhost:${port}`);
})

module.exports = app;
Troubleshooting
Not seeing critical changes? You may need to add path fixes to your codecov.yml configuration.
profiling:
  fixes:
    - "before/::after/"  # move path   e.g., "before/path" => "after/path"
    - "::after/"         # move root   e.g., "path/" => "after/path/"
    - "before/::"        # reduce root e.g., "before/path/" => "path/"
You can also check out our example repository to see a complete setup.
Caveats
NodeJS and takeCoverage
takeCoverageThis package relies heavily on the takeCoverage and other supporting methods added to with Node 15.1.0. While these methods are generally useful and allow Impact Analysis to function properly, there are some caveats to consider:
- Due to the nature of node coverage profiling (essentially calling
takeCoverageagain and again and using snapshots), coverage tracking cannot be paused, and may run in a way that poses an impact on performance.- On approach to address this problem, calling
stopCoverageis not a possibility, because oncestopCoverageis called,takeCoverageraises errors. - Initial experiments do not indicate a significant hit to performance, likely due to
takeCoverage()et al being native.
- On approach to address this problem, calling
- There seems to be no way to avoid the disk-write in a naive way
- If
NODE_V8_COVERAGEcould be mapped to memory, that could be more performant solution.
- If
- Getting the saved filename is a bit error-prone. We can't know for sure what the filename will be because it's generated on the fly. See: https://github.com/nodejs/node/.../src/inspector_profiler.cc#L172 So there is the possibility that at some point race conditions may occur, although this is not likely.
- There seems to be a bug in node opentelem in that calls
spancontextas a function, but that is not a function. Before fielding this in a production context, opentelemetry-js will need a fix.- example of incorrect use: https://github.com/open-telemetry/opentelemetry-js/.../src/export/BatchSpanProcessorBase.ts#L83
- There are some minor concerns with block coverage versus line coverage. For example, the output from the profiler is in the format:
        // ...
        {
            "scriptId": "115",
            "url": "file:///Users/thiagorramos/Projects/opentelem-node/examples/app.js",
            "functions": [
                {
                    "functionName": "",
                    "ranges": [
                        {
                            "startOffset": 1062,
                            "endOffset": 1107,
                            "count": 1
                        }
                    ],
                    "isBlockCoverage": true
                }
            ]
        }
        // ...
which shows byte ranges (1062 to 1107 in this case). This means that coverage is on the statement block level, rather than line coverage. To compensate for this discrepancy, for now, this package assumes that if bytes A to B involve lines C to D, then all lines from C to D are covered.
6. This package assumes that the "byte intervals" that show up in node coverage are presented in pre-order when looking at the interval tree. This package makes no assumption that byte intervals are presented in pre-order, and thus will reorder if needed, However, the package still assumes they are tree intervals and that there will be no unusual overlaps (as in, two intervals that overlap but are not contained one inside another).
OpenTelemetry Caveats
- Due to the nature of async js, opentelemetry tracks the request from the moment it is received until the moment of response. So for example, on:
app.get('/hello', (req, res) => {
  console.log("WE ARE INSIDE THE REQUEST")
  res.send('SPECIAL Hello ' + req.query.name + req.query.value);
  let a = parseInt(req.query.value);
  let b = a + b;
  if (a > 10) {
    console.log("It's higher than 10")
    // some extra logic
  }
}
Opentelemetry will execute onEnd right after res.send happens. Which means that it won't wait for the extra logic to run.
- JS coverage output doesn't seem to split a 'stataments block' into two when needed. The idea is that two consecutive statements, unless separated by an if/while/return/etc, are always either both executed or neither.
- So, still on the above example, lines 68 (
let a ...;) and 69 (let b = ...;) are in the same statement block as line 66 (console.log("WE...")). Due to the async nature of js, coverage stopped tracking before they were executed, so they should not show up on the coverage result. But they do, because since line 66 was executed, and they are part of the same statement block, it doesn't make sense for them to not have been executed. - While this is generally preferred, problems do arise in some cases. Consider the
ifstatement on line 70, for example. Line 71 (console.log("It's higher...")) also clearly runs on some cases (wherea > 10), but is always considered not covered on the reports, because it is on a separate statement block and happens after ares.send.
- So, still on the above example, lines 68 (
Updated 5 months ago