Python Quick Start [Impact Analysis]
This guide is meant to get you started using Impact Analysis with Codecov as quickly as possible on python projects
Prerequisites
In order to get started, you will need a repository that is
- using python 3.6+
- already integrated with Codecov
- running in a production-like environment
- generating telemetry data via OpenTelemetry. If your repository is not yet doing this, we recommend checking out the Open Telemetry python repository for details on how to get started first.
Getting Started
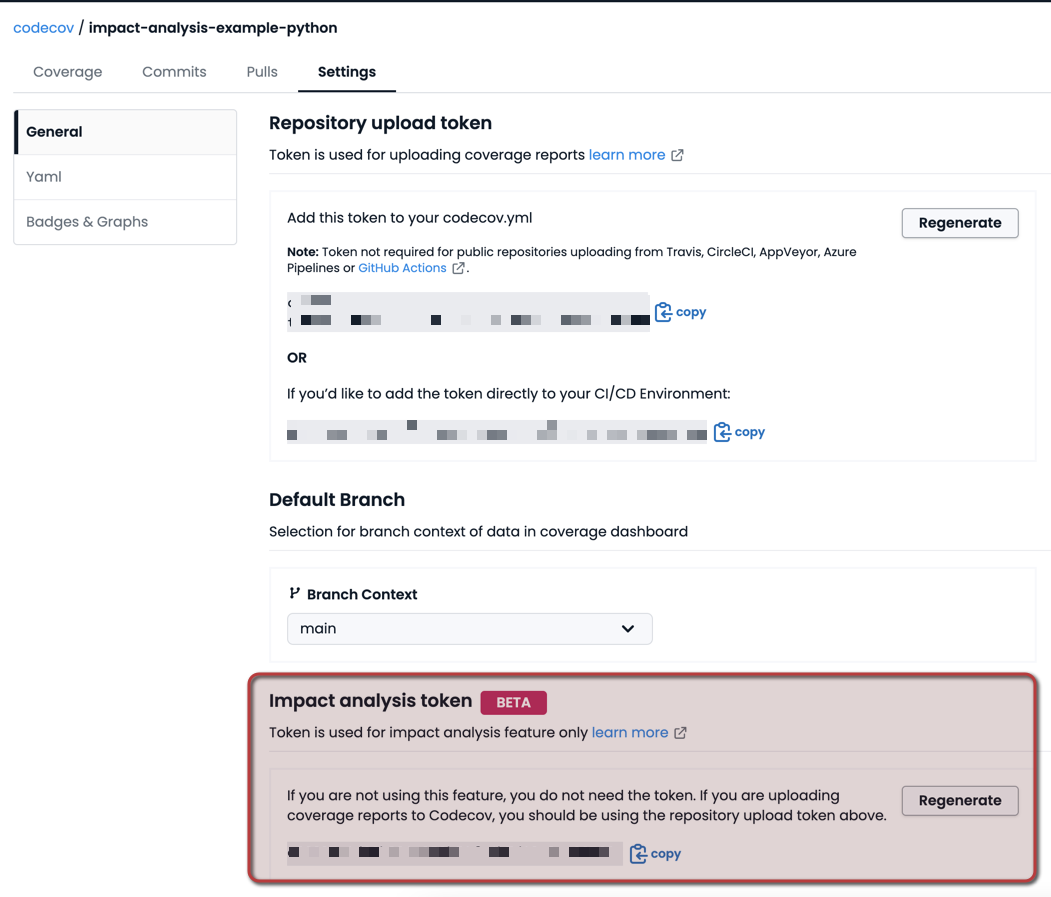
Step 1: Get your Impact analysis token
In your repository settings page on Codecov, copy the Impact analysis token to be used when uploading telemetry reports

Step 2: Update your dependencies
Add the following dependency by running
pip install codecovopentelemBe sure to save down the dependencies to requirements.txt or similar.
Step 3: Add in the Codecov OpenTelemetry package
Wherever you currently instantiate your open-telemetry instance, add the following lines of code
from codecovopentelem import (
    CoverageSpanFilter,
    get_codecov_opentelemetry_instances,
)

...

provider = TracerProvider()
trace.set_tracer_provider(provider)

current_version = os.getenv("CURRENT_VERSION", "0.0.1")
current_env = os.getenv("APP_ENV", "production")

# export_rate: Percentage of spans that are sampled with execution data.
# Note that sampling execution data does incur some performance penalty,
# so 10% is recommended for most services.
# Values should be between 0 and 1.
export_rate = 1
# untracked_export_rate: Percentage of spans that are sampled
# without execution data. These spans incur a much smaller performance
# penalty, but do not provide as robust a data set to Codecov,
# resulting in some functionality being limited.
# Values should be between 0 and 1.
untracked_export_rate = 0

generator, exporter = get_codecov_opentelemetry_instances(
    repository_token=os.getenv("CODECOV_OPENTELEMETRY_TOKEN"),
    version_identifier=current_version,
    sample_rate=export_rate,
    filters={
        CoverageSpanFilter.regex_name_filter: None,
        CoverageSpanFilter.span_kind_filter: [
            trace.SpanKind.SERVER,
            trace.SpanKind.CONSUMER,
        ],
    },
    code=f"{current_version}:{current_env}",
    untracked_export_rate=untracked_export_rate,
    environment=current_env,
)
provider.add_span_processor(generator)
provider.add_span_processor(BatchSpanProcessor(exporter))
Configuration Details
variable | description |
|---|---|
current_version |
|
current_env |
|
code | A unique identifier for the current deployment across all environments where it may be deployed. Conventionally, this is a combination of version number and environment name, but can be anything as long as it is unique in each environment for the version being deployed. |
export_rate |
|
repository_token |
|
untracked_export_rate | Currently unused, should remain at 0. |
If desired, the filters parameter can also be changed to provide different filtering on any valid OpenTelemetry SpanKind as defined by the specification.
Step 4: Update the codecov.yaml configuration
In order to get Impact Analysis data in your pull requests, add the following lines of code to your codecov.yaml file
comment:
  layout: "diff,flags,tree,betaprofiling"
  show_critical_paths: true
Commit the above code and run your code in production as usual. Note that it may take 30 minutes for the changes to propagate.
Seeing Impact Analysis in your pull requests
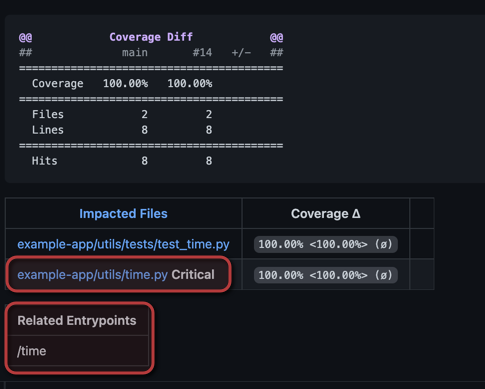
After you have followed the steps above, you will need to run the code in a production-like environment. To see changes in your pull requests, make a code change on
You should be able to see two differences. The first notates Critical on files that have code run frequently in production that are also being changed. The second shows API endpoints that are affected by the pull request.

If you are making changes to code that is not deemed critical, you should still see the following in your pull request comment from Codecov.

Integration Examples
The specifics of how this library is integrated into your project depends on the project itself. This section contains a few common, framework-specific, integration approaches along with the general integration approach at the end.
Note that these examples demonstrate possible ways to incorporate this package into your project. As always, your specific needs may vary.
Flask
In a Flask application, you could place the code snippet in your application's app.py file before the call to initialize your Flask app, like so:
from opentelemetry.instrumentation.flask import FlaskInstrumentor

# Snippet Code ...
# Other Startup Code ...

app = Flask(
    __name__,
    static_url_path='',
    static_folder='',
    template_folder='templates',
)

FlaskInstrumentor().instrument_app(app)

# app.route(...)
# ...

app.run(host='0.0.0.0', port=8080)
Django
In Django, you can place this snippet in your application's <application_name>/wsgi.py file:
import os

from django.core.wsgi import get_wsgi_application

from utils.config import get_settings_module

os.environ.setdefault("DJANGO_SETTINGS_MODULE", get_settings_module())

#... Other Startup Code

from opentelemetry.instrumentation.django import DjangoInstrumentor
try:
    # Snippet Code
except UnableToStartProcessorException:
    # Handle the Exception...

DjangoInstrumentor().instrument()


application = get_wsgi_application()
Note that this example also demonstrates how to integrate using a try/except.
General Integration
If you are not using Django or Flask integration is still possible by using the above code snippet. How to do this may vary greatly depending on your use case. In general, though, the code snippet should be placed wherever you would put your application's OpenTelemetry startup code. In lieu of that, this code should be incorporated in such a way that it is part of your application's startup process.
Troubleshooting
Not seeing critical changes? You may need to add path fixes to your codecov.yml configuration.
profiling:
  fixes:
    - "before/::after/"  # move path   e.g., "before/path" => "after/path"
    - "::after/"         # move root   e.g., "path/" => "after/path/"
    - "before/::"        # reduce root e.g., "before/path/" => "path/"
You can also check out our example repository to see a complete setup.
Updated 5 months ago